Connection Monitor
Overview
The availability of a server connection depends on many factors and can vary significantly, particularly if the client computer is connected over a slow wireless connection, such as GSM. Analyzing connection problems and availability is often a complex and time-consuming task, and several special tools are available for these tests:
- The tool Connection Test enables the user to perform a quick and simple test of the current connection to the LogWeb/Ajax server.
- The tool Connection Monitor is described here.
This tool is an extension of Connection Test and enables long-term monitoring of the server connection.
- The tool Session Administration
displays the status of the current LogWeb/Ajax sessions.
As in many cases, hundreds of sessions are active and you can filter them according to diverse criteria. Depending on your security guidelines, it is even possible to log into an active session in order to provide an individual user with help.
- The tool Access Log supports you when evaluating log files that were written on your server by a servlet container (for example Tomcat) or a Web server or proxy (for example, Apache).
The Connection Monitor described here, is an extension of the
Connection Test
and offers the following possibilities:
- Quick test of the LogWeb/Ajax server.
Several increasingly complex standard server requests are performed automatically:
- Long-term monitoring of the server connection.
A simple test loop is carried out.
- A test program sends a request to the server.
- The program measures the time until it receives the request, logs it and displays it as a time diagram.
- The request is repeated after a period of time has elapsed.
- If the server does not receive a response from the server for more than 30 seconds, the request is also repeated.
In the case of the LogWeb/Ajax server, the server response is also evaluated and the test is aborted if errors occur.
Content:
Starting the program
The Connection Monitor is usually started via
LogWeb/Ajax
Help Tool, but (depending on the confuguration) it can also be started via an active LogWeb/Ajax emulation.
If there is no active connection to the server at this point, the program cannot be loaded. Depending on your system environment, the browser displays an error message in a "pop-up box" or in a new window. This can occur either immediately or with a delay.
Depending on your security settings, MS Internet Explorer may ask you to grant the program special rights for performing browser extensions. This is due to the application of graphical display functions in the Connection Monitor.
If you want to use all functions the Connection Monitor offers, you must authorize these rights.
Loading the connection test usually takes only seconds but can take longer if the connection is slow.
When all components have been loaded, a quick self-test is performed:
- The internal routines are tested.
- The elapsed time is dynamically displayed and loaded from the server.
- The graphical display functions are tested.
Program view
The program is fully displayed after the initial test is successfully performed.
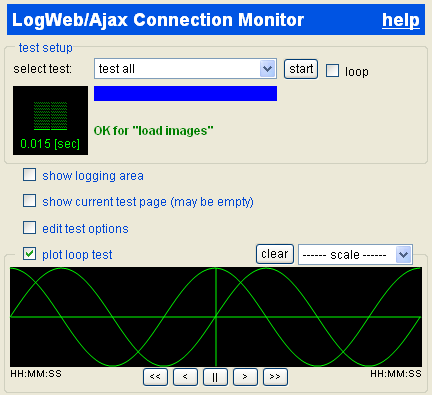
Meaning of the displays:
- The upper area test setup contains:
- A drop-down list select test which is preset to access ajax servlet.
- The start button.
- The loop option.
- The display on the left shows the elapsed loading time of the previous test,
which is usually less than one second.
- The blue bar shows the progress of the quick test.
- The "message area" below displays
OK for "load images" after the program is started successfully.
- By selecting show logging area the test log is displayed.
- By selecting show current test page the page currently loaded from the server is displayed.
The test page loaded from the LogWeb/Ajax server during the quick test is verified internally but usually not displayed. It only contains input fields.
- By selecting edit test options the test options are displayed.
- By selecting plot loop test the time diagram is displayed.
The display appears after the loading process is completed and contains a test picture in the form of a sine curve.
If the display is incorrect, particularly if the image displaying the elapsed time is missing, the connection may be disrupted.
- In this case, try to restart the program (select restart in the browser menu).
- If this fails again, you may first open a new browser window and use it to access another Web page. Depending on your system environment, however, your Internet access may be restricted, for example, to your company domain.
- Alternatively, you can try to use another Internet service; you could for example send yourself a test e-mail.
- If this attempt also fails, your Internet access is probably disrupted.
In this case, contact your Help Desk.
- If the window is only displayed correctly after a second try, and if a subsequent quick test reveals a disruption, you should also inform your Help Desk of the failed attempt to start the connection test.
Quick test of the LogWeb/Ajax servers
If the Connection Monitor has been started from an active LogWeb/Ajax emulation, you can perform a quick test as in the Connection Monitor.
However, if you start the Connection Monitor using another method, no LogWeb/Ajax session identification is passed over, the quick test is aborted and an error message is displayed:
ERROR 501 for "access current session":
The session with the identifier "0" cannot be found.
A quick test requires only two steps:
- Select test all from the drop-down list.
- The click the start button on the left.
During the test, the button is labeled stop.
Standard tests are performed successively and automatically in order of increasing complexity:
- Internal selftest
- Loading a simple page from from the LogWeb/Ajax server
The page is tested internally but is usually not displayed.
If necessary, it can be displayed by clicking show current test page.
- Loading of a standard response page from the LogWeb/Ajax servlets
- Test query of the current condition of the LogWeb/Ajax session
- Test query of the current data of the LogWeb/Ajax session
- Test query of the current data of the LogWeb server session
The individual steps of the test can require different amounts of time. Each test should be completed within approximately 1 second, provided that the connection speed is sufficient.
- The time required for every test is dynamically displayed.
- In addition, each test result is displayed in the message area.
- If an error occurs, the test sequence is aborted. In this case, an error message is displayed.
- If, in an exceptional case, a test takes longer than 30 seconds, you can abort the quick test by clicking stop.
If an error occurs, ask your Help Desk for advice.
Messages
The messages are displayed in the message area and simultaneously recorded in the test log:
- OK for "load images"
Message for a successful completion of the program start.
- OK - passed all tests
Message for a successful completion of the standard quick test.
- ERROR -1 for "access ajax servlet":
aborted by user
Test is aborted by clicking stop during the test step "LogWeb/Ajax servlet".
- ERROR 501 for "access current session":
The session with the identifier "XXXXX" cannot be found.
The test was aborted because the LogWeb/Ajax server responded to the last request with an error code 501 and the corresponding message.
Reason: The LogWeb session tested in this step has terminated in the meantime.
However, server access is fully functioning.
- ERROR 501 for "access current session":
The session with the identifier "0" cannot be found.
Similar to the message described above: The test was aborted because the session could not be found.
However, server access is fully functioning.
- ERROR -99 for "access ajax servlet":
Timeout: trying to restart the connection
Can only occur when monitoring a LogWeb/Ajax server in the loop test.
Reason: Waiting for a response from the server was aborted because the time limit was reached. The loop test will be continued; the next server request will take place after the set waiting time has elapsed.
- ERROR: received unexpected response,
probably from previous access specified base URL.
This message can only occur when the test step access specified base URL is selected; This test step is not part of the quick test.
Meaning: A page has been loaded which calls up a follow-up page via JavaScript programming. This behavior can be normal (dependent on the page that is called up), but it cannot be decoded by the connection test. This behavior can be normal (dependent on the called-up page) but it cannot be decoded by the Connection Test.
Further test options
The following additional test options are available.
- Select show logging area to display the test log.
- Select show current test page to display the page that is currently loaded from the server.
The test page loaded from the LogWeb/Ajax server during the quick test is verified internally but usually not displayed. It only contains input fields.
- Select loop to perform a loop test. Depending on your select test selection,
the LogWeb/Ajax server
or any other server is monitored.
- Select edit test options to display the test options.
- Select plot loop test to display the time diagram.
- In this test, a send button (ENTER or DUE1) is activated via your active emulation and the current screen of your emulation is sent to the mainframe.
Depending on the application, this can cause unintended behavior of the host application.
For this reason, this test is not carried out with the standard quick test.
- The loop test for the surveillance of the LogWeb/Ajax server can also be carried out by one of the other test options in the drop-down list select test.
Monitoring the LogWeb/Ajax server
To start monitoring the LogWeb/Ajax server, proceed as follows:
- In select test above, select the input access ajax servlet. This option is preset when the program is started.
- Check loop
- If necessary, you can specify further test options in edit test options:
- The repeat field defines how many times the test step is to be repeated.
If you do not make an input, the field is automatically filled with the value 1000 at the start of the test.
- In the delay field you define the delay time before repeating a test step. The time is specified in milliseconds. If you do not enter a value, the value 30000 is automatically used. This sets the delay before the next test step to 30 seconds each.
- The content of the SessionID field is in this case attached to the HTTP request in the form of a comment. This enables you to easily identify your monitor calls in the HTTP log.
- Click the start button on the left.
During the test the button is labeled stop.
During the surveillance, you have the following options:
- The surveillance can be aborted at any time by clicking stop.
- Another click on start continues the surveillance.
- During the test, the progress is displayed in the message area. The response time, remaining number of tests and the delay time before the next test are displayed.
- The graphical display of the measurement as a time diagram can be viewed by clicking plot loop test.
Monitoring another server
In contrast to the LogWeb/Ajax server surveillance, the response from the server cannot be verified for correctness at this point; any response from the server is accepted, even an HTTP error message "404 - page not found".
To start monitoring the server, proceed as follows:
- In select test select access specified base URL.
This option is preset when the program is started.
- Select loop
- Select edit test options to display the test options.
- In the base URL field, enter the complete URL of a page on the server to be monitored, for example http://www.google.com.
- The repeat field defines how many times the test step is to be repeated.
If you not enter a value, the value 1000 is automatically used at the start of the test.
- In the delay field, you define the waiting time before a step in the test is repeated. The time is specified in milliseconds. If you do not enter a value, the value 30000 is automatically entered. This sets the waiting time before the next test step to 30 seconds each.
- Click the start button on the left.
During the test the button is labeled stop.
When monitoring, you have the following options:
- Monitoring can be aborted at any time by clicking stop.
- Click start again to continue monitoring.
- During the test, the progress is displayed in the message area. The response time, remaining number of tests and delay time before the next test are displayed.
- The graphical display of the measurement as a time diagram can be viewed by selecting plot loop test.
Test log
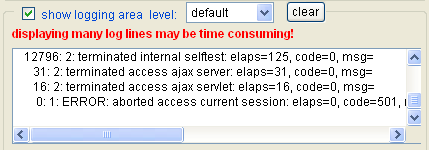
Select show logging area to display the test log.
This option is usually used only after you have contacted your Help Desk.
- After a successful program start, it contains inputs for loading the image, displaying the elapsed time and the graphical functions:
     124: 2: loading http://jf-xp:8084/web.onkey/connection/imgstatus/status0.bmp
      32: 2: loaded all: http://jf-xp:8084/web.onkey/connection/imgstatus/status9.bmp
       0: 2: terminated load images: elaps=32, code=0, msg=
     985: 2: lw.JS.load: url=../include/excanvas.js
    1062: 2: terminated "initPlot"
- If the standard tests have been performed successfully, there is an additional input for each step of the test: The elapsed time in milliseconds, the completion code and the completion message are displayed:
   10262: 2: terminated "internal selftest": elaps=110, code=0, msg=
      31: 2: terminated "access ajax server": elaps=31, code=0, msg=
       0: 2: terminated "access ajax servlet": elaps=0, code=0, msg=
      16: 2: terminated "access current session": elaps=0, code=0, msg=
       0: 2: terminated "access current session data": elaps=0, code=0, msg=
      15: 2: terminated "access LogWeb session": elaps=15, code=0, msg=
- You can select the log with Ctrl+A and copy it into the clipboard with Ctrl+C.
You can then process the log as usual and, for example, e-mail it to your Help Desk.
- If necessary, you can also select a log stage other than default.
- Click clear to delete the test log.
- If you select the export to log function in the time diagram, the measured values are exported into the log area.
You can then copy the measured values into the clipboard and process them in another application (for example, a spreadsheet program).
You should abort the loop test or set the logging step to errors only prior to the export. Otherwise, additional logs are added to the exported values.
Test options
Select edit test options to display all test options.
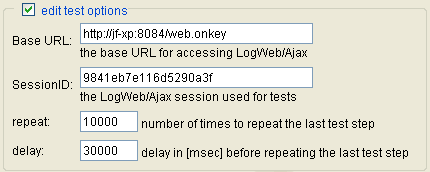
- Enter the URL of the server to be monitored into the Base URL field.
When the program has been started, the field displays the base URL of your LogWeb/Ajax server; you should not change this input for a loop test with access ajax servlet.
If you want to monitor any other Web server, enter the complete URL of a page on that server, for example http:www.google.com, and then select the test step access specified baseURL.
- The input field SessionID identifies the LogWeb/Ajax session, that you want to monitor in the test steps access XXX session.
It is only filled in automatically if you start the program from an active LogWeb/Ajax emulation via [Help]/[Connection Test].
Exception: In a loop test with access ajax servlet the field input is attached to the HTTP request as a comment. This enables you to easily identify your monitoring calls in the HTTP log.
- The repeat field specifies the number of times a test step is to be repeated in the loop test.
If you have not made an input here, the field is automatically filled with the value 1000 when the loop test is started.
- In the delay field, you define the waiting time before the repetition of a test step in the loop test takes place. The time is specified in milliseconds.
If you do not make an input, the field is automatically filled with the value 30000 when you start the loop test. This sets the delay before the next test step to 30 seconds each.
Time diagram
Select plot loop test to display the time diagram of the loop test.
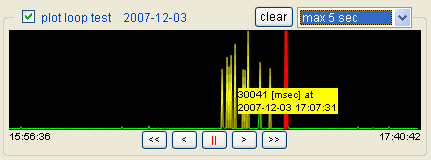
- The date of the current time frame is displayed in the top left corner (in this case, 2007-12-03).
- The clear button resets the diagram displaying the time measurements. Any loop test that is still active is not aborted.
- The drop-down list on the top right enables you to specify several settings.
- The options under scale define the solution of the measured delay.
The most accurate solution is displayed with the selection max 0.1 sec but usually you select a solution of 1.5 seconds.
The measured delay is not lost when you select another solution. They are only displayed in another scale ("higher" or "lower").
- Using export to log, all measured values are exported to the log area.
You can then copy these values to the clipboard and process them in another application, for example, a spreadsheet program. You need to abort the loop test prior to the export. Otherwise, additional logs are added to the exported values.
- import from log imports measured values from the log area.
This is only a support function: You can only import values that you previously exported.
- The remaining test alternatives only support functions for internal tests.
- The area in the middle displays the time diagram of your test series.
- New values measured are added on the right.
- If there are more measured values than the display can show, the older values move out of the display on the left side. However, you can still view these values by using the scroll bar at the bottom to move the display to any position.
- If you change the size of the browser window, the size of the display is adjusted and more or fewer values are displayed.
- Depending on the measured waiting time, the values are displayed in green, yellow or red.
- If you move the mouse into the display area, information about the measured value and the time of measurement are displayed (in this case, 30041 milliseconds waiting time at 17:07:31).
- In the lower area on the right and on the left, the times of the first and last visible measurement values are displayed (in this case, 15:56:36 and 17:40:42).
- The "recording buttons" in the lower center allow you to move your test series left and right if the entire series cannot be displayed.
If you use this function to scroll through the display, the display automatically stops moving but the loop test is continued.
© Logics Software 2006 - 2009